Reporting & Decision Systems
Why Reporting & Decision Systems Matter More Than Ever
Business Intelligence (BI) has moved from a “nice to have” to a core operational capability. Organisations that actively use BI consistently outperform those that rely on static reporting and intuition.
HBR and McKinsey research shows that companies using data-driven decision-making are:
More to Acquire Customer Acquisition
Data-driven companies are far more effective at finding and converting new customers because they leverage data to optimize targeting, marketing, and product-market fit.
More Likely to be Profitable
Gains from revenue scaling, cost savings, and smarter investments drive profitability.
Better Operational Efficiency Improvement
Companies with mature data & AI practices report much more improvement in how smoothly their operations run: fewer bottlenecks, automation, better process design.
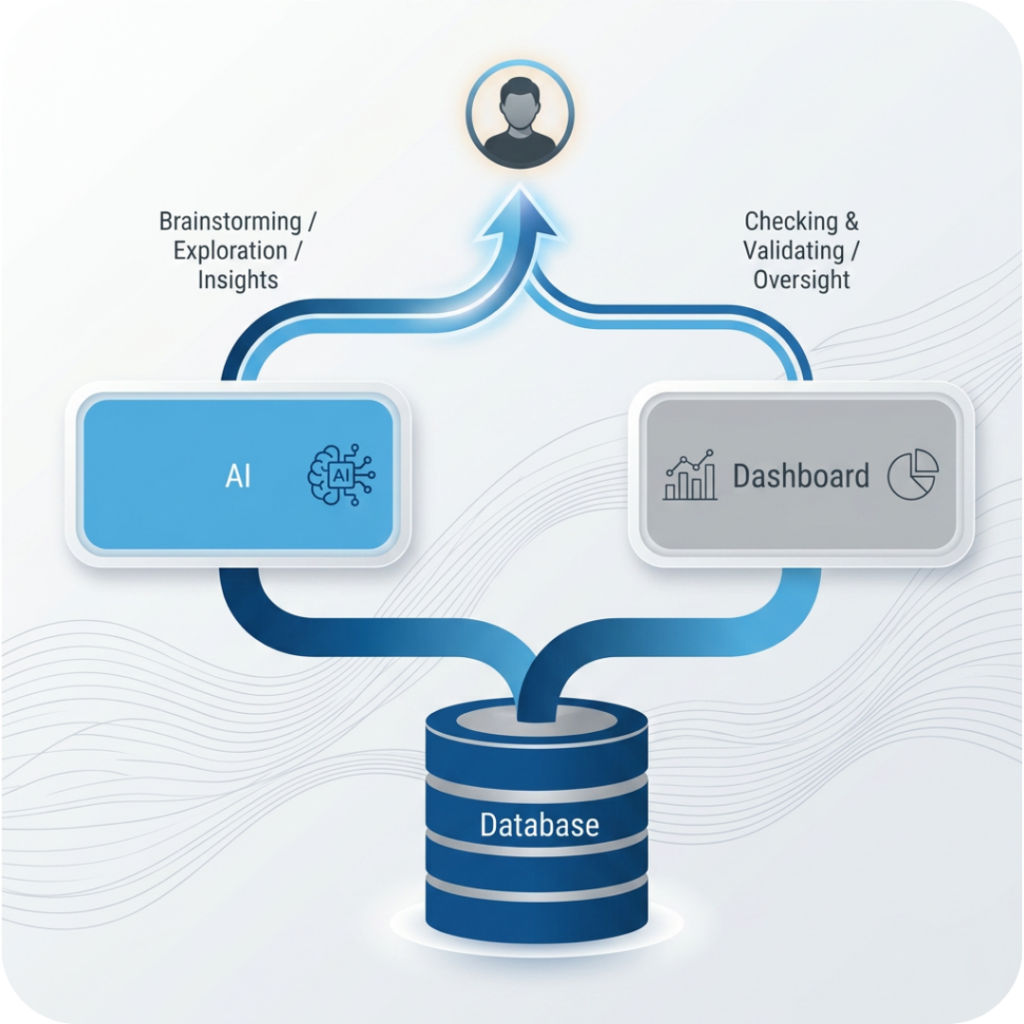
How it works: the Reporting + AI Foundation
AI can generate insights fast. But fast insights built on bad data are worse than no insights at all.
Before you deploy AI, you need reporting foundations in place:
Verifying AI-generated outputs against actual data
Providing traceability behind numbers and assumptions
Anchoring decision-making in controlled, auditable logic
With this foundation, AI becomes trustworthy and genuinely useful. Without it, you’re making decisions on unverified outputs.
Why Companies Typically Invest in BI Reporting
The work is not just about pipelines. A large part of data improvement comes from making quality issues visible enough for the business to act on them. That is why our approach combines technical integration with operational accountability.
Many organisations employ financial controllers, analysts, and operational managers who spend a significant portion of their time:
Exporting data from systems
Cleaning and reconciling spreadsheets
Creating charts in Excel
Rebuilding the same slides in PowerPoint every week or month
BI reports automate this entire process:
- Data refreshes automatically (daily, hourly, or near real-time)
- Reports are always up to date
- No manual rebuilding of visuals
Lower labour cost per insight
Faster access to information
No more waiting for “the next report version”
Built-in reports in ERP, CRM, or other operational systems are often limited. Excel and PowerPoint add flexibility, but at the cost of reliability and scalability.
Dedicated BI reporting goes significantly further:
Advanced analytics (AI features, regressions, forecasting)
Rich, interactive visuals
Multi-page reports with slicers, drill-throughs, bookmarks, and tooltips
Crucially, data transformations are hard-coded and governed:
- Calculations are defined once
- Logic is consistent across the organisation
- Results stay correct over time
Reports are published to a central BI platform where:
- Access is controlled
- Reports are available on any device
- Users no longer search through folders or email attachments
This creates a trusted, intelligent single source of truth.
In an AI-driven environment, this becomes critical infrastructure. It ensures that:
AI outputs can be validated against reliable, governed data
Teams avoid acting on hallucinated or inconsistent insights
Decisions remain grounded, even as tools become more automated and creative
Most businesses already sit on far more data than they actively use.
Data is typically spread across:
ERP systems
CRM platforms
Manufacturing or testing machines
Web tools and external data sources
Extracting, combining, and analysing this data is technically complex – which is why many organisations simply don’t do it. BI reporting removes this barrier.
By combining data across systems, companies unlock:
- Cross-functional insights
- Root-cause analysis instead of surface-level metrics
- Competitive advantages that are hard to replicate
This enables organisations to:
Grow faster
Reduce costs
Detect risks earlier
Avoid operational and quality failures
It also creates the foundation for more advanced AI usage:
- Cross-functional insights
- Root-cause analysis instead of surface-level metrics
- Competitive advantages that are hard to replicate
Discovery
Our Approach to BI Report Development starts here.
Where a BI project starts largely determines whether it delivers value. We scope each engagement using one of three proven entry points, chosen to match your data maturity, risk appetite, and business priorities.
Automate & Enhance an Existing Report
The lowest-risk entry point. Because the report and its user base already exist, we deliver value without introducing new processes or change-management overhead.
Workshop: Strategic Objectives
We work with leadership to define the metrics that drive the business revenue, margin, cost, delivery, and translate them into an executive dashboard that gives a single, clear view of performance.
Workshop: Data Source Review
We map your data across source systems to establish what exists, where it lives, and how it connects. This consistently surfaces insight opportunities that were previously invisible – especially powerful for operational optimisation, quality and supply chain analytics, and tactical decisions.
Then it continues with:
1. Setup
If a Power BI / Microsoft Fabric environment does not yet exist, we set it up with:
- Clear workspace structure
- Access control
- Deployment and governance strategy
This ensures scalability from day one.
2. Integration
We connect to source systems using:
- Dedicated credentials
- APIs
- On-premises gateways where required
Relevant tables and data scopes are defined to ensure performance and security.
3. Transformation & Modelling
Raw source data is transformed into a clean, analytical data model:
- Business logic is standardised
- Metrics are clearly defined
- Models are optimised for performance and usability
This step is critical for reliable reporting.
4. Report Development
Report pages are designed to answer real business questions. Users can:
- Filter and slice data
- Drill into details
- Explore trends and drivers
The focus is always on clarity, usability, and decision support.
5. Testing & Deployment
Reports are first published to a testing environment:
- Functional testing by our team
- Data validation with business users
Once approved, reports are deployed to production.
6. Enablement
Users are trained to:
- Navigate reports
- Interpret insights
- Confidently use BI in daily decision-making
This ensures adoption and long-term value.
The Results?

01.
Advanced, automated BI reports can be developed from
02.
Reports can be made in as little as just 1 day!
03.
We’ve seen customers achieve Measurable ROI in less than one month
04.
Significant time savings almost immediately
Starting small and delivering quick wins is the fastest way to build organisational buy-in. From there, BI naturally expands across departments - putting the entire organisation on a path to being truly data-driven.
Our Technology Stack
Power BI – Enterprise Reporting Built for Microsoft 365
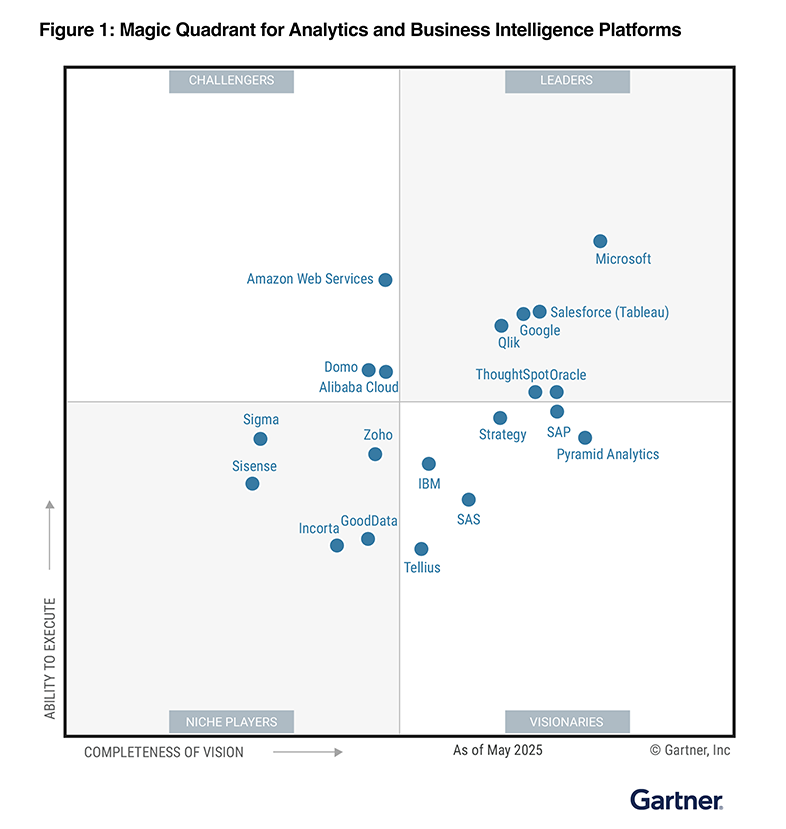
Power BI consistently ranks as a market leader in Business Intelligence platforms in independent analyst evaluations. It is widely adopted across industries and trusted by organisations ranging from SMEs to global enterprises.
Compared to other reporting tools, Power BI stands out for its balance of:
Enterprise-grade governance and security
Strong self-service capabilities
Competitive licensing and total cost of ownership
Rapid innovation driven by Microsoft’s ecosystem
For organisations already using Microsoft 365, Power BI is particularly compelling:
Native authentication via Azure Active Directory
Seamless access through browser, desktop, and mobile apps
Tight integration with Teams, SharePoint, Excel, and Outlook
Centralised access control using existing M365 security groups
Key Benefits of Power BI for Reporting
Define metrics once and reuse them consistently across the organisation. No conflicting numbers, no spreadsheet sprawl.
Users explore data with filters, drill-downs, and guided navigation instead of consuming static reports.
Handles large data volumes and growing user bases while remaining fast and responsive
Built-in AI, forecasting, and statistical capabilities enable deeper insight when required.
Enterprise-grade security with row-level access, role-based permissions, and Microsoft compliance standards.
Seamless integration with Microsoft Fabric and Azure allows reporting to evolve into a full data platform without rework.
Do you need to get AI ready?
Whether you are looking to setup entirely new infrastructure or just want to understand what is possible we are happy to have a chat.
- Free Consultation
Let's talk
Follow Us on Linkedin
Follow the most recent information about the company on our official Linkedin page.
Contact Us
Visit Us
Brigital B.V.,Prinsengracht 160 1016 HA Amsterdam Netherlands, KVK: 86702029
Write To Us
contact@brigitalgroup.com
Copyright © 2026 All rights Reserved. Design by brigital